HP/Agilent/Keysight 53230A weirdness
The 53230A is a very nice and capable instrument, but it does have some peculiarities that should be taken into account when using it for precise frequency counting.
It is reasonably well known that the counter does not produce frequency estimates that yields a true ADEV in its documented gap free CONTinous mode[1]. There exists an undocumented mode, RCON, that does give the correct ADEV, also gap free[2].
What may be less well known is that there exists a systematic bias in the first frequency estimate returned following an INIT. This may not sound like a big deal, but it can easily be.
There's a couple of ways to correctly retrieve gap free measurements from the 53230A; either using FETCh, DATA:REMove, R or READ. The required number of samples must be configured with a combination of SAMPle:COUNt and/or TRIGger:COUNt, for a total number of measurements returned = Sample Count x Trigger Count.
Note that READ is equivalent to INIT;FETCH - every call to READ implicitly calls INIT. If READ is to be used to return a time series of unbiased frequency measurements, all readings must be retrieved with a single call to READ.
It is entirely reasonable to retrieve a time series of single frequency estimates by using multiple calls to READ, and it is easy to imagine legacy scripts doing precisely this[3]. However, this will give biased results, as shown below.
Using repeated calls to READ in order to retrieve a time series in fact has a few issues:
- The measurements will not be gap free, even if the counter is set in gap free
RCONmode, so the measurements will not yield the correct ADEV. - The measurements are not dominated by white PM noise, so even accounting for deadtime between measurements does not yield the correct ADEV.
- The measurements will have a frequency bias.
The magnitude of the bias is highly dependant on the gate time and measurement mode.
Frequency bias test
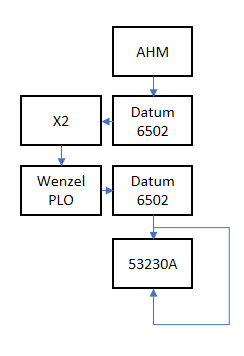
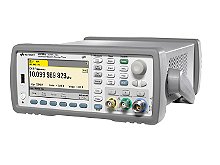
A stable 10MHz signal derived from the Active Hydrogen maser as shown on the right was applied to External Reference Input and Channel 1 input on the Keysight 53230A. Auto-calibration was executed once prior to starting the data collection.
Channel 1 input was configured with AC coupling, 50 Ohm input impedance, and trigger level set automatically with INPut1:LEVel:AUTO ONCE. With the exception of gate time and frequency measurement mode, the settings was not changed during the measurements.
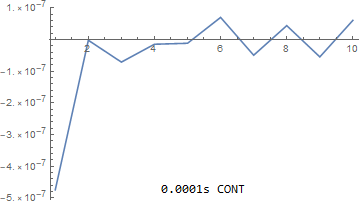
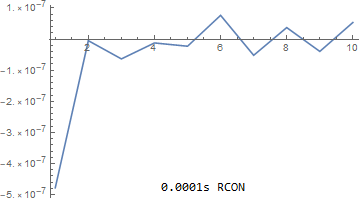
The 53230A was configured to capture 10 gap-free measurements on each trigger, in CONT and RCON mode respectively. Data was fetched in 15-digit ASCII-format using READ by a custom software program[4], and repeated 1000 times. For each READ, 10 measurements was collected. The data was arranged in a matrix, each row corresponding to a single trigger. Each column was averaged, and the resulting fractional frequency deviation plotted[5].
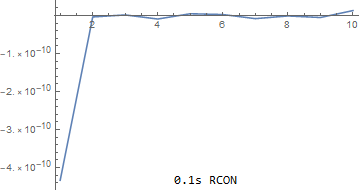
The results are shown below. Gate time and measurement mode is shown.
 |  |
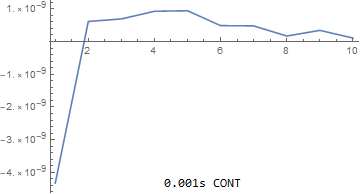 | 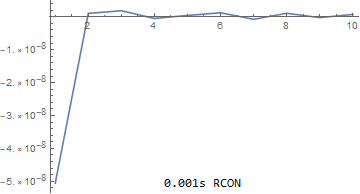 |
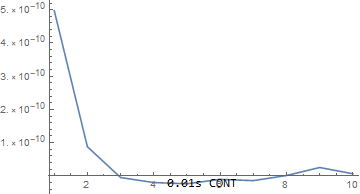 | 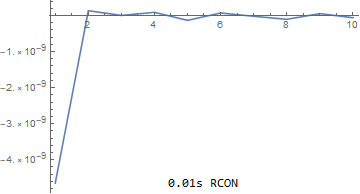 |
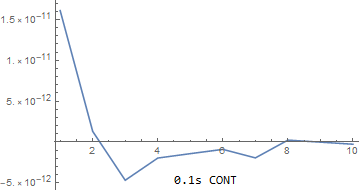 |  |
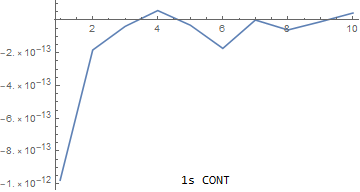 | 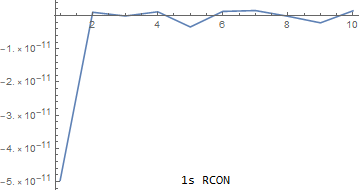 |
The measurements was run several times, with 1000-3000 repetitions, and the results were highly repeatable. The test was also run reading the measurements in 64-bit binary format. Measurement mode RECIProcal also show biased estimates. 5 MHz REF and DUT was tested. Datafiles for these tests are available upon request. The tests shown here was run on both firmware version 2.05 and 2.07 of the counter, with similar results. Other firmware-versions have not been tested.
To illustrate the issue, a measurement of 1 hour was run using TimeLab v1.29b, which uses repeated calls to READ to get measurements. The counter was configured as follows, all other settings left as default:
:INP:IMP +5.00000000E+001;
:INP:LEV:AUTO ONCE;
:FREQ:MODE RCON;
:FREQ:GATE:TIME 0.1
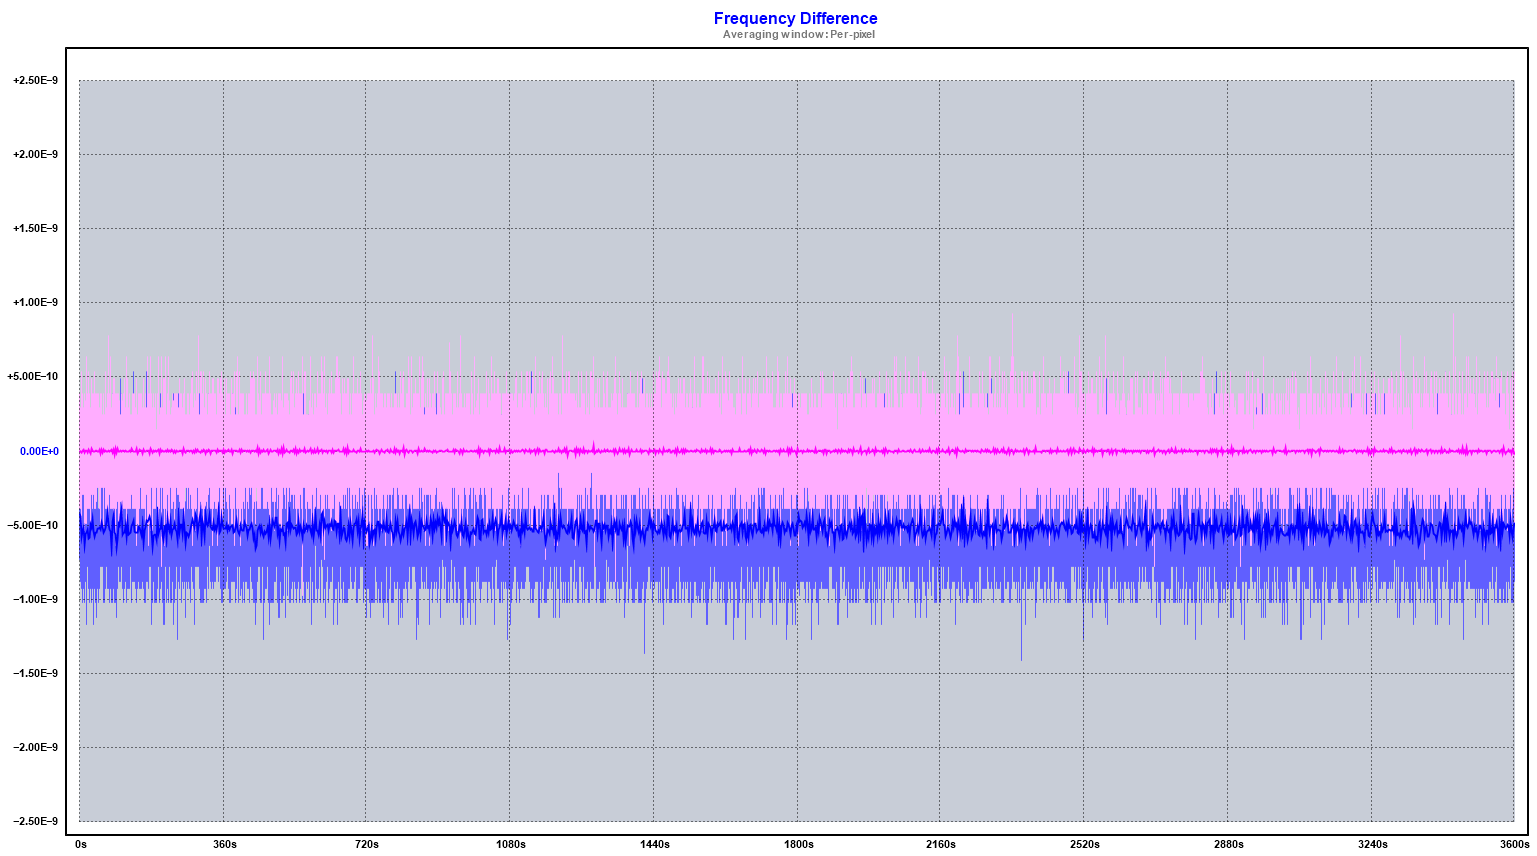

The blue plot shows 1hr/36000 samples collected using repeated READs. The pink plot shows 1hr/36000 samples collected using a custom script with a single call to INIT followed by repeated calls to FETCH. The data was then loaded into TimeLab for the comparison.
The frequency offset in the biased data is obvious in both the frequency and phase plots, and at -5.2E-10 agrees fairly well with the measurements above. The unbiased data has the expected offset near 0.
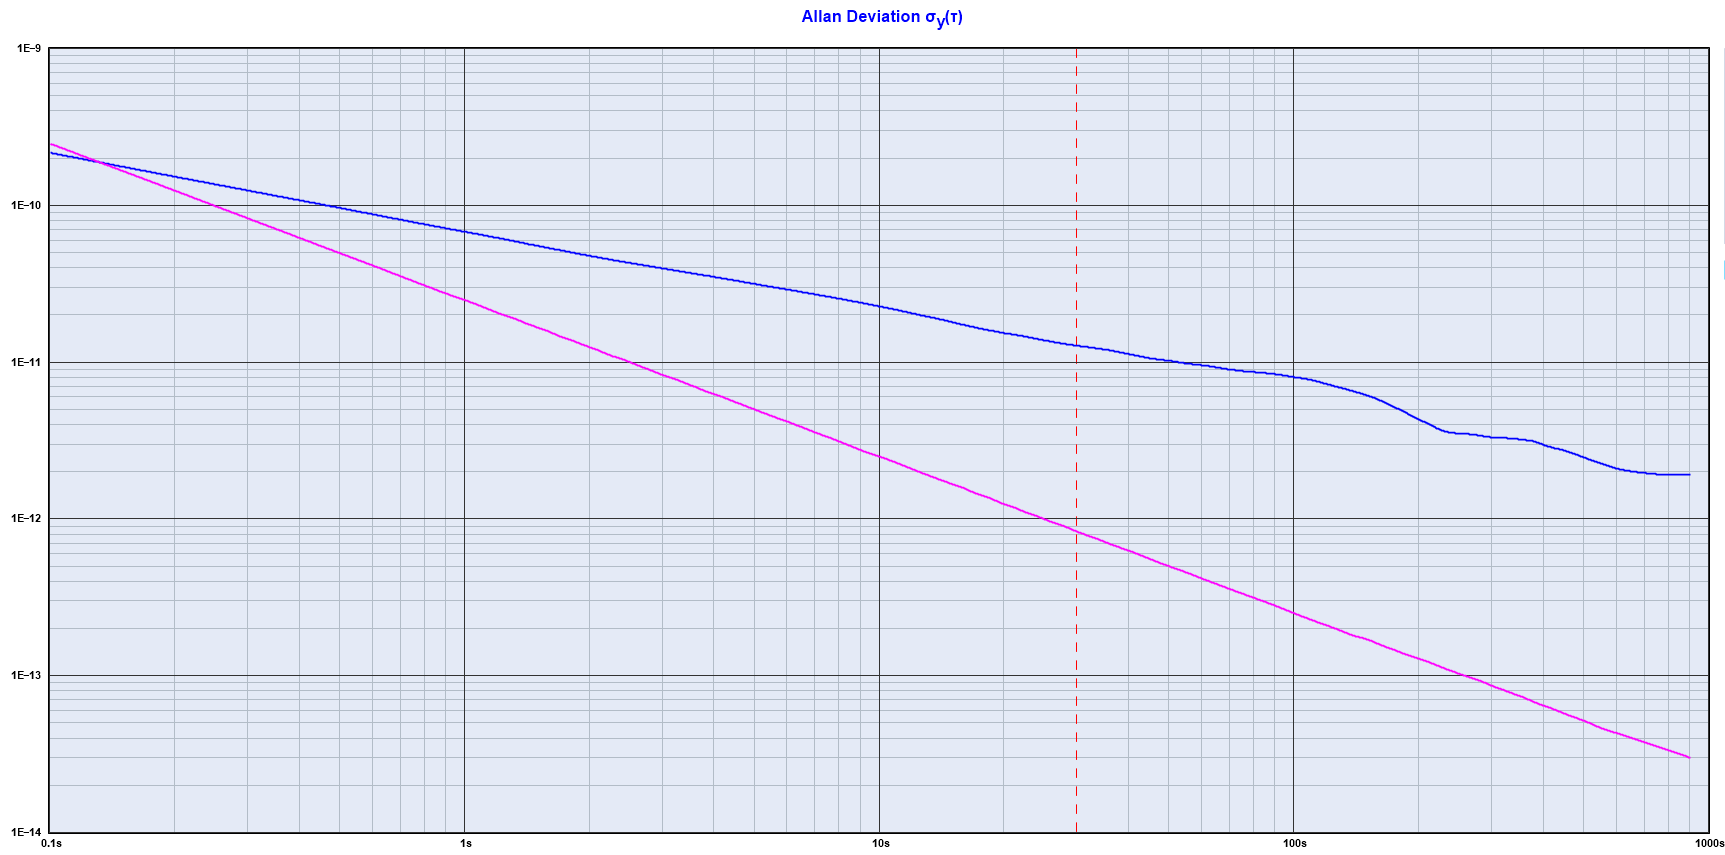
The ADEV plot for the biased data shows a slope of Tau-1/2, an indication that the measurements are not dominated by white phase noise as would be expected. The residual phase plot confirms random walk noise. The unbiased data shows the expected Tau-1 slope.
Finally, this test is a little "artificial". The signal measured is phase coherent with the reference signal, and the interpolators will only be used over a very narrow range. A more "real world-like" scenario is tested in part 2. Spoiler alert - the bias does not go away.
It should be stated that I have not had the opportunity to run these tests on another example of the 53230A - it is possible that the anomaly is somehow a defect in my personal counter. See part 3 where the bias is confirmed on other 53230a's.
The unprocessed datafiles and .TIM-files used to produce these plots are available here
Conclusion
In conclusion, pay close attention to how frequency measurements are retrieved from the instruments, or you may be looking at biased data. Simply plugging the 53230A into an existing framework of scripts may not produce the results expected.
[1] On temporal correlations in high-resolution frequency counting
[2] Much has been said, and more probably will be, about using frequency estimates as the basis for calculating ADEV. While ADEV is used as a means of identifying unexpected statistical properties of the frequency estimates, I do not advocate using frequency estimates to calculate ADEV. Nor do I advocate using phase. Advocacy is not the point of this discussion.
[3] For instance, this is how TimeLab retrieves measurements from these counters.
[4] https://github.com/opronningen/53230A-Test and https://github.com/opronningen/53230A-Toolkit
[5] A small Mathematica script was used to generate the plots:
files = Sort@FileNames["*.csv"];
Table[Export[StringReplace[f, "csv" -> "PNG"],
  ListPlot[Mean[(Import[f, "Table", "FieldSeparators" -> ";"] - 1*^7)/1*^7],
   Joined -> True, PlotLegends -> Placed[f, {Center, Bottom}], PlotRange -> All, ImageSize -> Medium]], {f, files}]