Newer posts
18.11.2018: Solved! Midnight anomaly
I think I cracked it. Finally. That 1-2 ns anomaly in my PPP GPSDO, every night at 00:00:00 GPST that I've been fretting over for months. My wife was not as bothered by a couple of billionths of a second showing up in the measurements, but there you go.
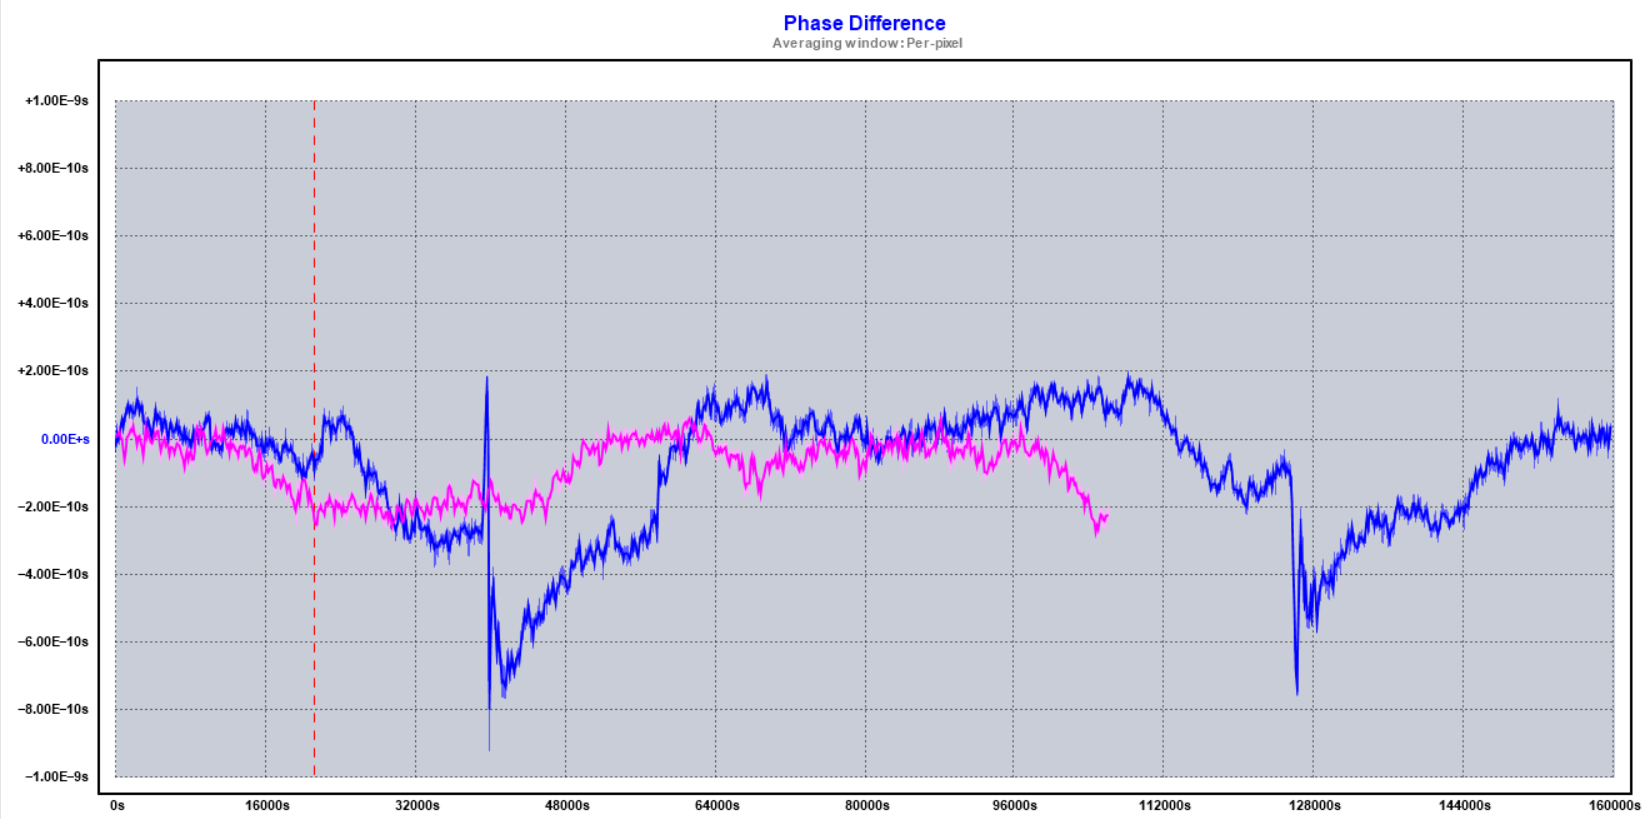
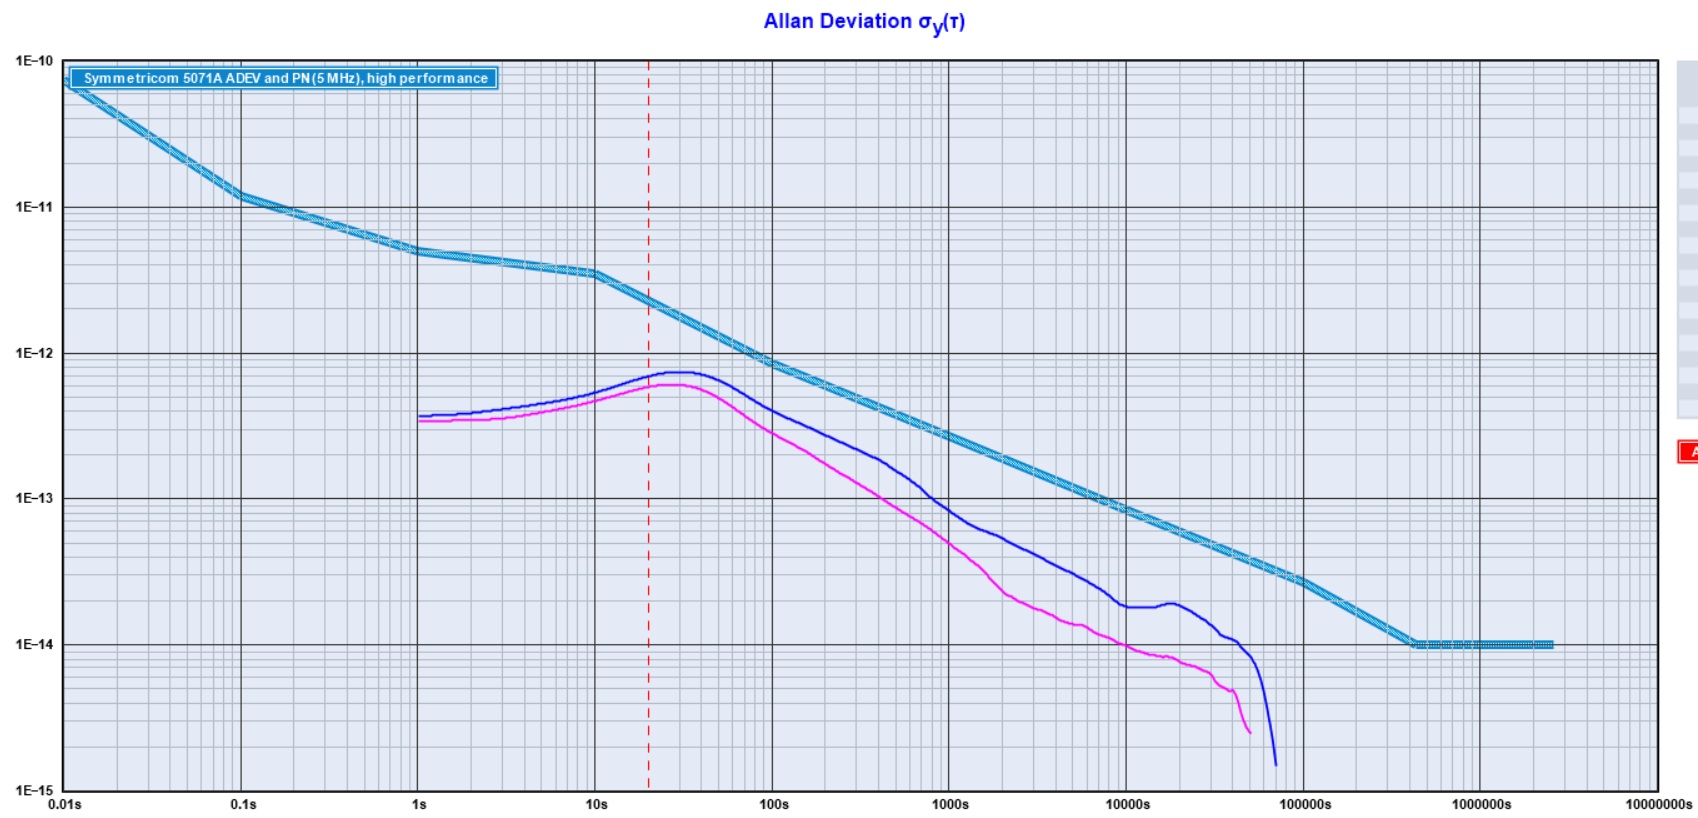
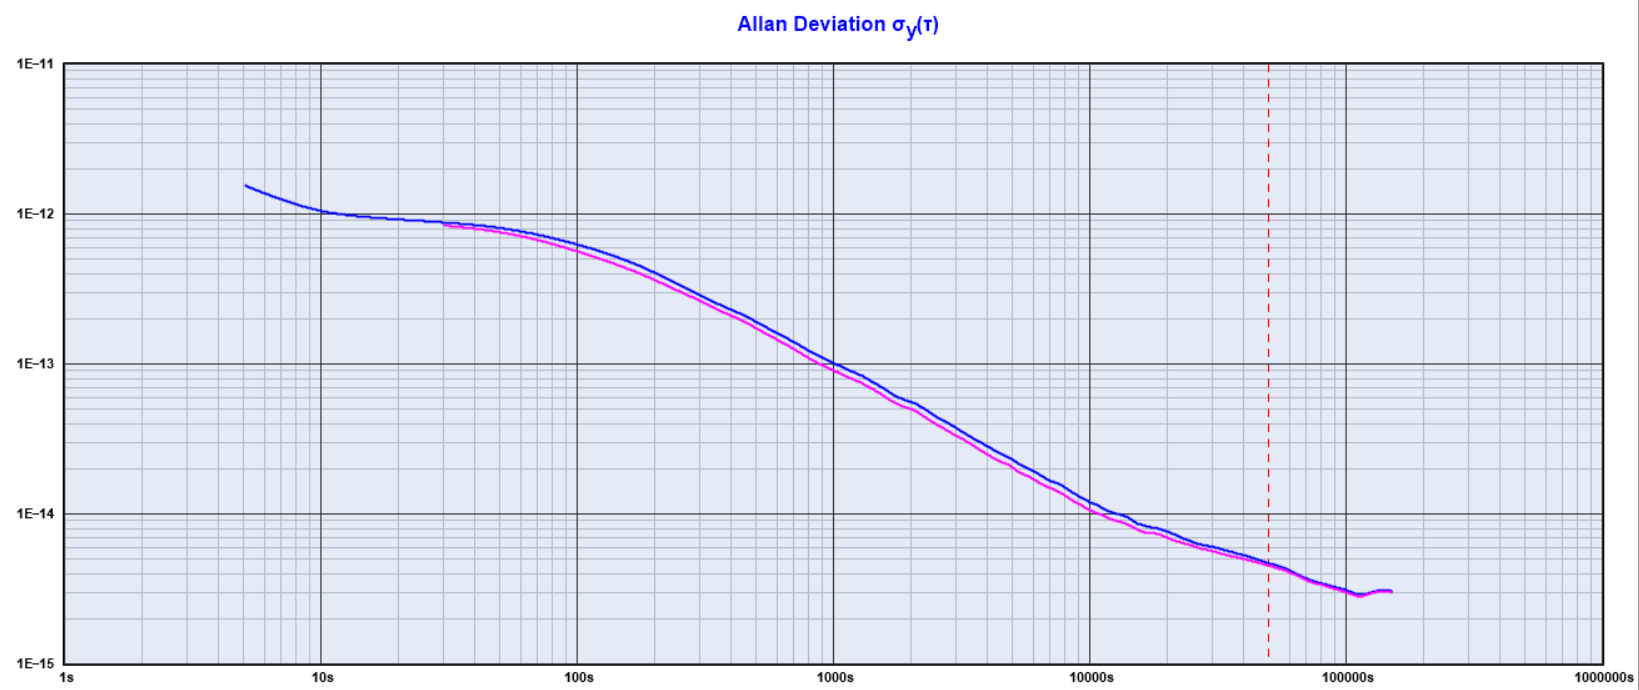
The plots on the right shows the results: the blue plot is 3 days without the fix, clearly showing spikes in the phase view at midnight. The purple plot is 2 days with the fix, clearly showing the absence of said spikes. The vertical dotted line is placed at 00:00:00 for the purple plot. Also shown is ADEV, showing the purple trace dipping below 1e-13 at about 400 seconds..
It turns out that the answer was staring me in the face all along, which was not completely unexpected — there are so many configuration options in RTKLib, and so little documentation for some of them, that a bonehead mistake is almost unavoidable.
In RTKNavi, there is a small tick-box called "DBCorr", on the same line as all the other corrections that should be applied to the observations. Mindlessly, I ticked all boxes; more corrections must be better, right? The purpose of this correction, as far as I can work out, is to handle the "Day Boundary Discontinuity"; an apparent clock jump that happens at 00:00:00 GPST. Under normal conditions, DBCorr would be a reasonable correction to apply — but not in this case as we shall see.
Figuring out what "DBCorr" means is also not completely trivial, since the documentation is somewhat sparse on the point. Long story short I had to set the flag, save the configuration, unset the flag, save another configuration, and find out which configuration-statement is changed by that flag. (It is pos1-posopt6. Obviously.) Then it is a matter of diving into the source, and try to work out which part of the code use this particular parameter — somewhat complicated by the fact that the configuration parameter corresponds to the 6th element of an array named posopt.
I always intended to go back and test most or all of the various knobs that can be twiddled in RTKLib, but hunting down this particular anomaly would mean measuring for at least two days for every change before any result can be considered even preliminary. So I put it off, waiting for a brainwave. A few days ago, that brainwave finally arrived. I previously speculated that the anomaly was caused by a filter reset, the response looked suspiciously similar to a cold start of RTKrcv — and now that I finally understand the issue, this is precisely what happens.
The source code for RTKLib is pretty dense, and sparsely commented, but I finally tracked down the culprit. In ppp.c, on line 666 (coincidence?) we find this snippet of code:
if (rtk->opt.posopt[5]) {
	clk_jump=ROUND(time2gpst(obs[0].time,NULL)*10)%864000==0;
}
This pretty much says that a clock jump is defined when the time is 00:00:00 GPST. And a few lines below, this little nugget shows up:
/* reset phase-bias if expire obs outage counter */
for (i=0;i<MAXSAT;i++) {
	if (++rtk->ssat[i].outc[f]>(unsigned int)rtk->opt.maxout||rtk->opt.modear==ARMODE_INST||clk_jump) {
		initx(rtk,0.0,0.0,IB(i+1,f,&rtk->opt));
	}
}
It basically says that if the outage counter is more than some value (by default 5), or the ambiguity resolution mode is set to "instantaneous", or there is a clock jump, reset the phase bias in the Kalman filter.
In both my geodetic receivers the Local Oscillator is (under usual conditions) steered towards GPST, ensuring that the phase bias is always small. I assume this is also the case for all/most other receivers. Resetting a small phase bias would not cause much trouble for the Kalman filter. In my use case, the Local Oscillator is not steered towards GPST, so the phase bias can be pretty large — at the time of writing several hundred microseconds for one of my receivers. Resetting this large phase bias to zero wreaks havoc with the filter, which takes hours to settle down.
In short, do not enable DBCorr/pos1-posopt6 if the Local Oscillator is not steered.
06.08.2018: RT-PPP with RTKLib — Be aware
Continuing my efforts to use real time PPP for time transfer, I stumbled across a small trap that could be of interest to others: I use rtkrcv* on Linux to process my observations. I have two instances running, one processing observations from my local GPS receiver, the other processing observations from a remote receiver clocked by a Hydrogen Maser. Both instances use the same stream of corrections. After running for many hours, I noticed that the two instances reports different number of corrections processed! This means that corrections are dropped somewhere along the line — which means that at least some epochs are processed with different corrections. The resulting phase measurement should/would be negatively affected.
After several days of uninterrupted operation, the numbers differs by many hundreds or even a couple of thousands.
My "solution" is to use strsvr to collect the corrections and redistribute to both rtkrcv-instances. If the corrections are dropped up-stream, at least both instances will have the same set of corrections, which is the point. From looking at the numbers, it seems the solution is not perfect, but the difference in number of processed corrections between the two instances is a lot smaller than before, less than a dozen or so.
As my TimePod is temporarily (I hope!) out of commission, I am unable to directly quantify the effect — but I fully expect it to be appreciable..
Of course, the difference could also be a trivial bug in the code counting number of corrections processed, but I somehow doubt that.
* I expect rtknavi to exhibit the same behaviour, but I have not tested this.
25.06.2018: ADEV e-14 at Tau < 600 seconds
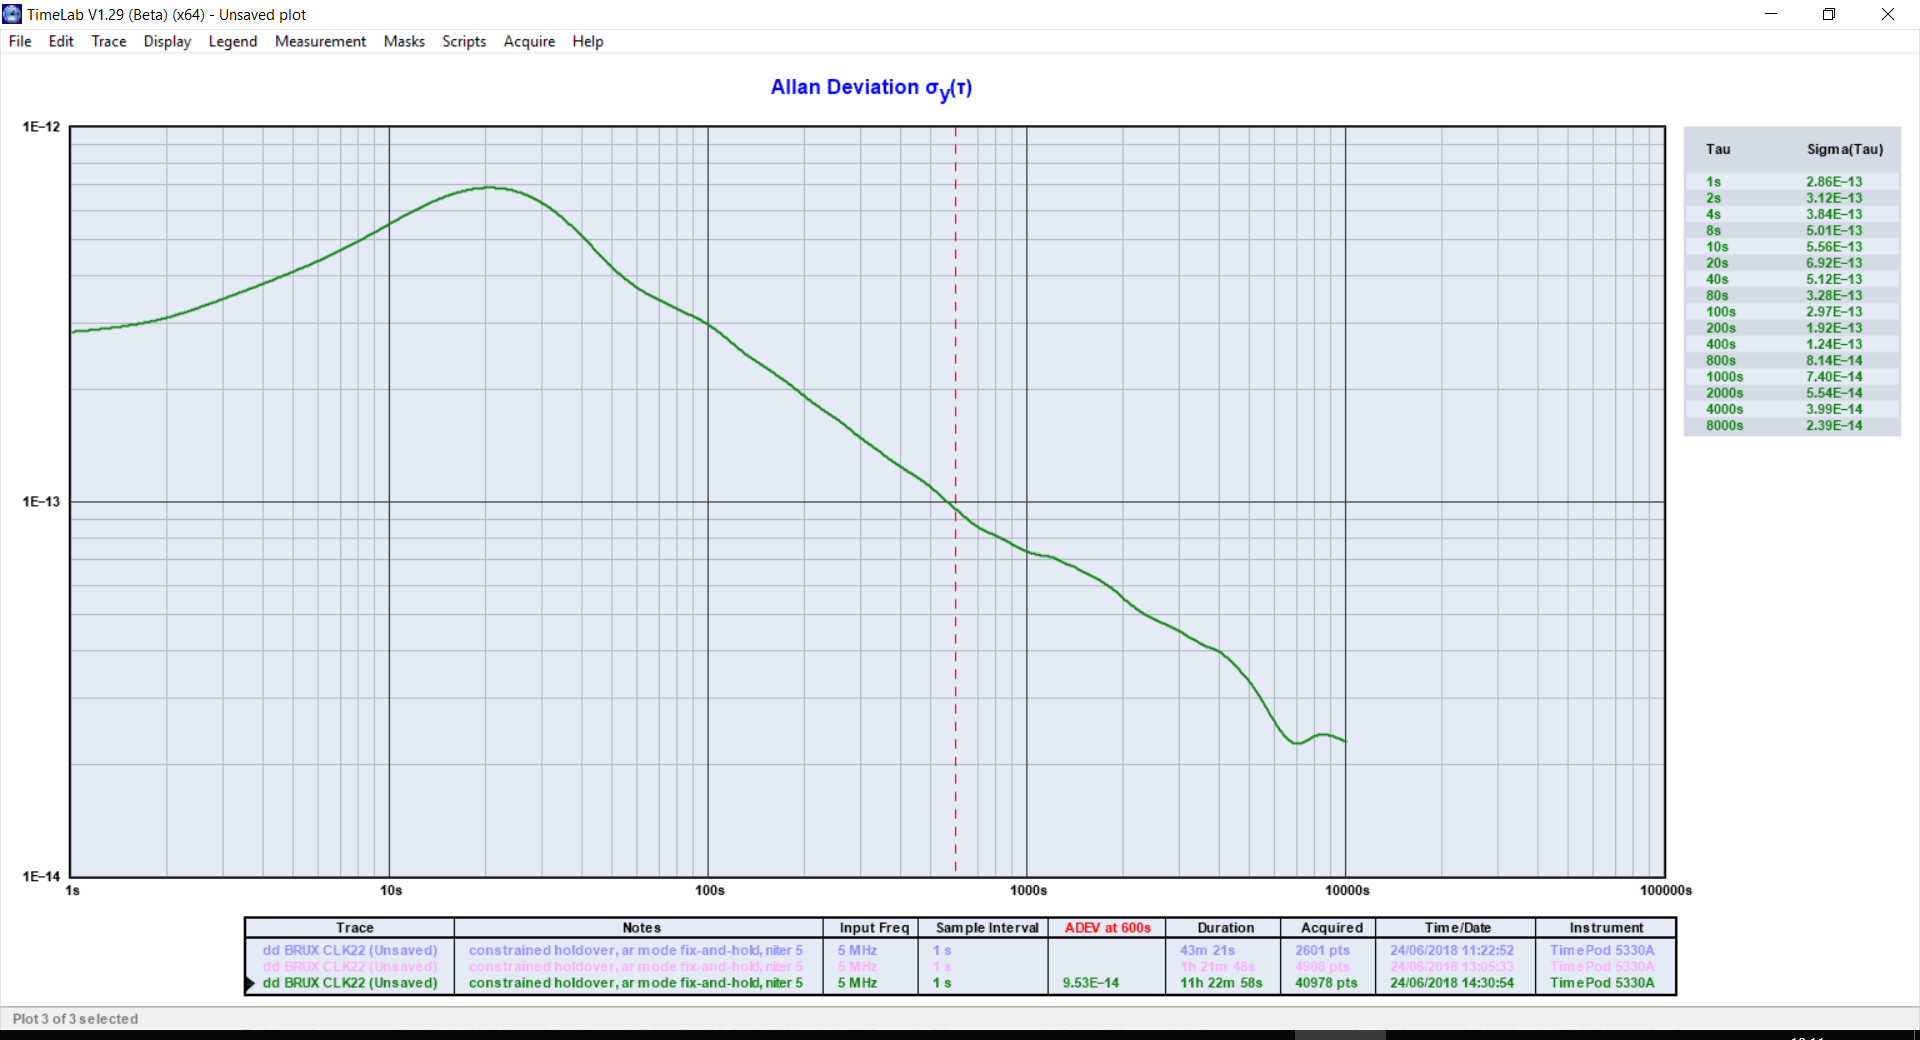
I previously posted (boasted) about reaching e-14 ADEV at about 2000 seconds with my L1/L2 PPP GPSDO contraption — which is pretty good. Yesterday I tinkered with the tuning a bit more, results left. A pretty good run, reaching e-14 at less than 600 seconds. The flip-side of the coin is ofcourse the "bulge"; but as this is well into the e-13 territory, I am not too despondent.
I am a lot more despondent about the "midnight anomaly" I described in my previous posts; at 00:00:00(GPST) everything goes haywire for an hour or so — the phase plot shows an "undulation" of up to a nanosecond or even more. I am no closer to finding the root cause of this than I was weeks ago. It is very frustrating..
The data for this plot stops just short of midnight.
20.04.2018: A good week for EFOS-3
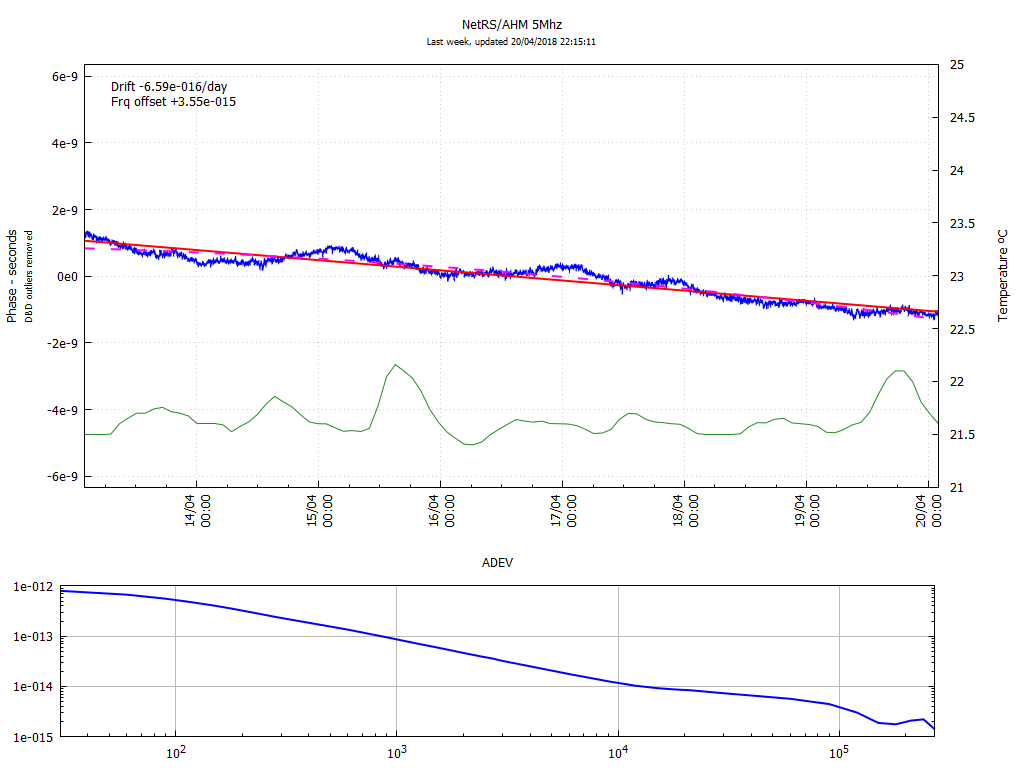
Looking at the plot on the right, my hydrogen maser EFOS-3 has had a pretty good week. The frequency offset, compared to GPST, is about 3.5e-15, not too shabby! In other words, in one week it has kept time to about 2 billionths of a second. In the course of a year, it would be off by about one tenth of one millionths of a second. The ADEV bottoms out around the specified floor of 2e-15, although the confidence interval is a bit "loose" this far right on the plot so we'll take that with a grain of salt. For an Active Hydrogen Maser, this stability is not spectacular — but keeping in mind this is a 30+ year old retired machine, living in a spare bedroom with nothing but domestic airconditioning for environmental control, I'd say it is quite acceptable!
The drift is below 7e-16 per day. Suspiciosly good for a maser that does not have cavity autotuning — and in fact I do have a "drift compensation scheme" going: every 22 hours I drop the internal synthesizer 1 count — corresponding to a frequency shift of around +7e-15. And it seems to work pretty well. I guess I could try to decrease that interval by another hour, but I don't trust my measurement setup that much — there is plenty of uncertainties, so I don't think much will be gained by chasing those last parts in e-16.
There is also the fact that the Trimble NetRS receiver doing the measurements here is clocked by a Wenzel PLO, phase locked to the maser. As was observed previously, the PLO introduces a frequency offset of one or two parts in e-15 — so attempting to get better accuracy than this is pretty pointless.
Also, at least looking at the plot, there are no obvious temperature related frequency changes to speak of — which is good news. The temperature is not as stable as it should be, but this week was pretty average; mostly gray overcast days without much change, but also a couple of really sunny and nice days. Good to know the aircon is able to keep the temperature stable enough for decent maser performance also when the sun is out.
The GPS antenna and cable is of course outside. Any temperature dependent phase shifts in these should show up on this plot — so from the looks of it I can be somewhat confident that whatever phaseshifts there are in the antenna and cable, it is pretty small. Small enough to not be much of an issue.
02.02.2018: PPP and sampling interval
In stability measurements, more data is (nearly) always better. On this premise, I've been logging GPS observations every 5 seconds for the past few months. The resulting files get large, and the processing time also increases, so I decided to check if I gain much by collecting all that data. 30 seconds is a "standard" interval used by both BIPM and IGS, so I ran a test to compare 7 days of GPS observations sampled at 5 second interval, versus the more traditional 30 second interval. The original data at 5 seconds was processed using gLAB, using the IGS Rapid corrections, and then reprocessed with decimation set at 30 seconds. See left, blue is 5 second interval data, pink is 30 seconds.
The answer seems to be no. In fact, if anything, the ADEV is better on the data collected with a 30 second interval. This, presumably, is due to interpolation of the 5 minute clock corrections in IGS Rapid. More interpolation equals more noise.
30 second sample interval it is, then.
27.01.2018: Solid Earth Tides!
If you've played around with geodetic GPS receivers and PPP, the term Solid Earth Tide pops up here and there. It's just one more of those tiny effects that needs to be modelled and accounted for in order to sqeeze out every millimeter of accuracy from the data. At least that is what I assumed, untill I more or less stumbled across the Wikipedia page on the subject:
"Earth tide [...] is the displacement of the solid earth's surface caused by the gravity of the Moon and Sun. Its main component has meter-level amplitude at periods of about 12 hours and longer."
Meter-level amplitude. Meter. In short, the earth beneath your feet rise, fall and shifts a significant fraction of a meter twice a day. I almost fell off my chair reading this for the first time. How could I not know this? A millimeter this way, a millimeter or two that way — sure. Why not. But a meter?! That is insane! And for some reason — very, very cool. It should also be easily spotted in my setup with geodetic GPS receivers continously logging.
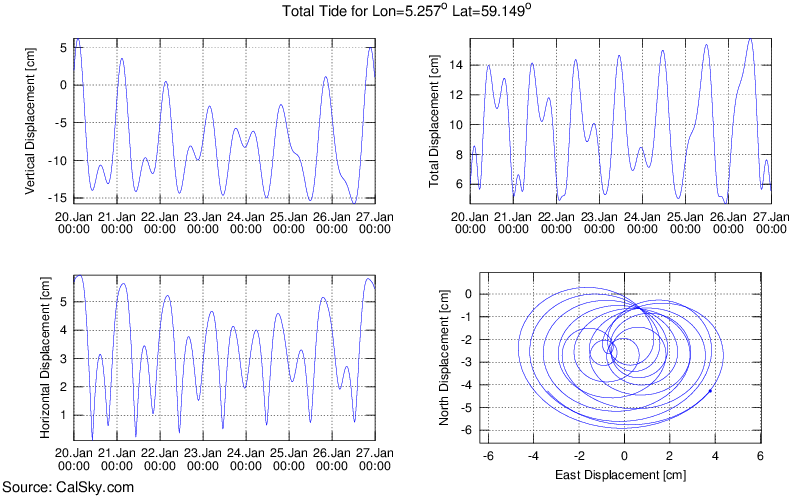
Calsky.com has a nice online calculator for Earth Tide that shows the tidal variations at any given location and time. For my location, the earth does not rise and fall quite a meter, more like a bit less than a foot for the period we're seeing here. Still cool. A foot at the speed of light is something in the neighbourhood of a nanosecond, and with a hydrogen maser as a reference to my receivers, a nanosecond should be clearly visible.
I used gLAB to process one weeks observations from a Trimble NetRS, and disabled the Solid Earth Tide modelling. The clock solutions (with and without solid tides modelled), was imported into TimeLab[1], as well as the vertical displacement as calculated by calsky.com[2] See below.
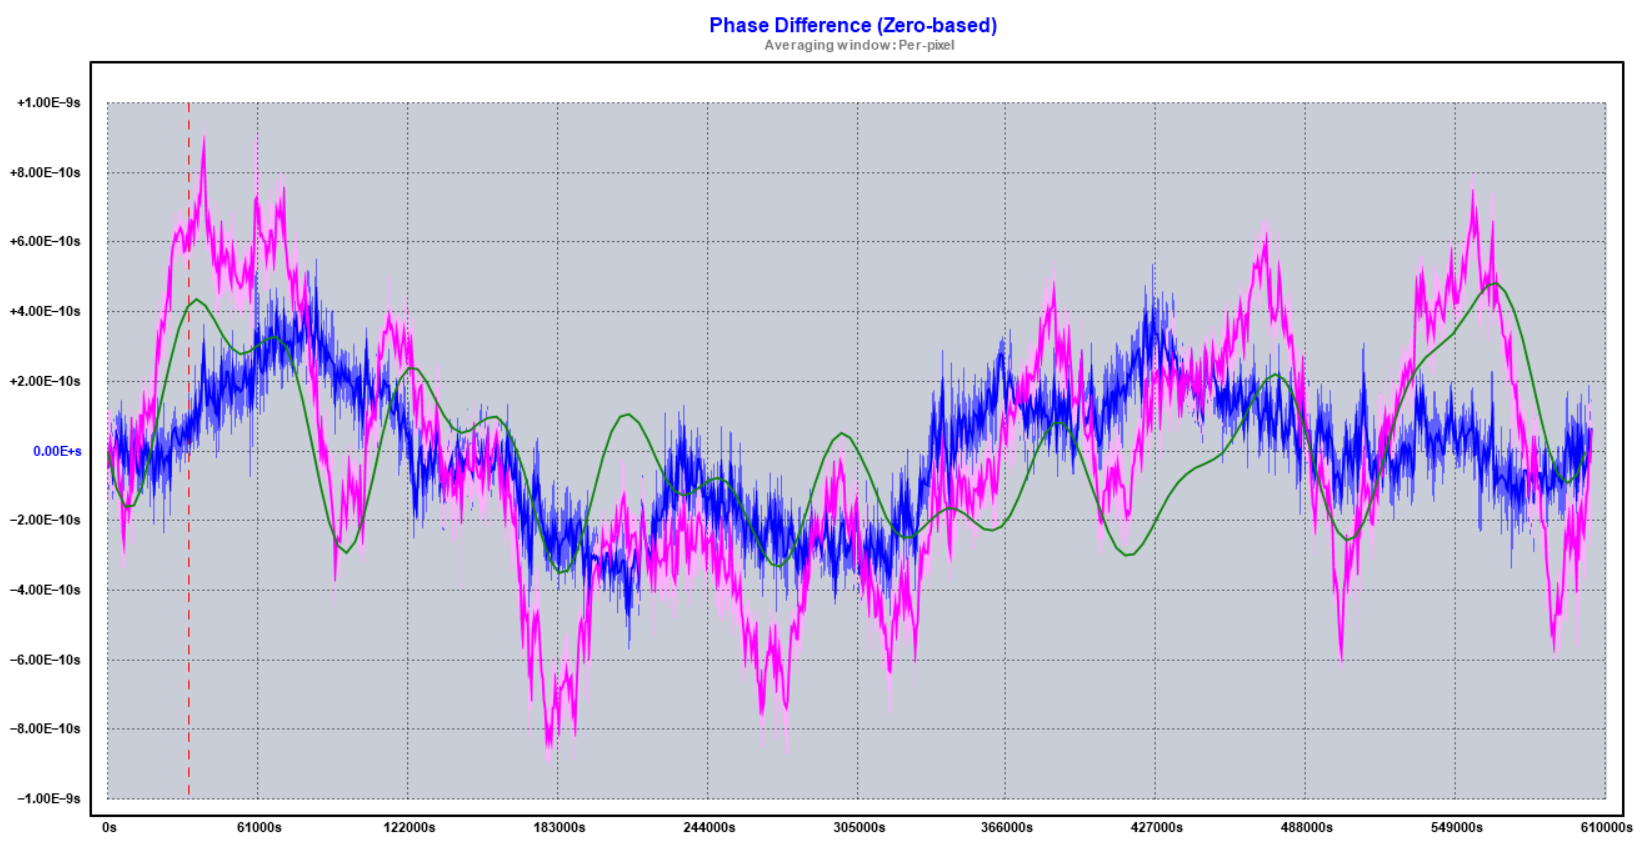
The Blue trace is the normal PPP solution, which models and removes the effects of Solid Earth Tide. The Pink trace is the same data, except it is not corrected for earth tide. The Green trace is the modelled earth tide from calsky.com.
The distance between my GPS antenna and the satellites is roughly 20200 kilometers. What is clearly visible in the plot is an uncorrected change in that distance of about 20 cm. Caused by the surface of the earth moving closer to the moon.
Pretty neat!
[1] Quadratic fit removed
[2] Recalculated from distance to time delay
All data used to generate the plots available here
Older posts